
2017 International WFTDA Championship Tournament Analysis: Game 15 Denver Roller Derby vs. Gotham Girls Roller Derby Assessment of Penalties
Last quarter for graduate school, I took a course called “Scripting for Large Databases” and learned to use a plethora of data analysis and visualization tools, including python, SQLite, mongodb, JSON, and matplotlib. For our final project, we were to analyze data publicly available online; naturally, I chose to analyze roller derby game statistics from champs.
Roller derby aficionados comb the WFTDA Stats Repository to determine how well certain players performed in WFTDA-sanctioned roller derby games. The WFTDA Stats Repository provides some interesting data – the “Diff/Jam” columns on the “Skater Stats” tab divide the points scored while a given skater is on the on the track by the points given up to the other team, broken down by position (jammer or blocker). Many in the roller derby community use this number to assess how well particular skaters performed in games.
However, this data does not account for the number of skaters on the track at a given time. Theoretically, skaters will perform better when their team has all five skaters on the track and the other team has several skaters sitting in the penalty box serving time for committing a penalty. What is the correlation between number of skaters on the track at a given time and point differential? I used Pandas, Python, Matplotlib, and Seaborn to attempt finding and visualizing the answer in the 2017 International WFTDA Championships Game 15: Gotham vs. Denver game. data: After downloading and reformatting the game data from the WFTDA Stats Repository, I first created a dataframe that provided a count of the number of penalties each team had accrued per jam.
jampenalties=pd.merge(jams, penalties, left_on="id", right_on="jam_id")
jampenalties2=pd.merge(jampenalties, skaters, left_on="skater_id", right_on="id")
jampenalties3=pd.merge(jampenalties2, teams, left_on='team_id', right_on="id")
df=jampenalties3[["jam_number", "name", "position",
"team_name"]].sort_values("jam_number")
dfgroup=df.groupby(["jam_number", "team_name"])[["name"]].count()
df1.columns = ["jam_number", "team_name", "penalty_count"]
Figure 1 Penalties Code
Then, I graphed the information using Seaborn:
redblue= ["red", "blue"]
sns.set_palette(redblue)
f, ax=plt.subplots (figsize=(15,8) )
sns.barplot(x="jam_number", y="penalty_count" , hue="team_name", data=df1 )
ax.set_yticks([0,1,2,3,4])
ax.legend(title="Team Name")
ax.set_ylabel ("Number of Penalties")
ax.set_xlabel ("Jam Number")
plt.title('Denver vs. Gotham Penalties Accrued Per Jam')
Figure 2 Penalties Graph Code
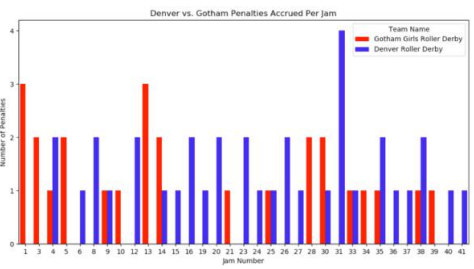
This barplot illustrates that Gotham had a significant number of penalties right out of the gate – fifteen in the first fourteen jams of the game, but only accrued eleven more penalties the twenty-seven remaining jams of the game.
Next, I isolated points scored per team on individual jams, to see if jams with many penalties led to many points scored for the opposing team.
points=skater_jams.loc[skater_jams["points"]>0]
points1=pd.merge(points, skaters, left_on = "skater_id", right_on = "id")
points2=pd.merge(points1, teams, left_on = "team_id", right_on = "id")
points3=points2[["jam_id", "skater_id", "name", "team_id", "team_name", "points"]]
points4=points3.sort_values("jam_id")
Figure 4 Points Scored Per Jam Code
In order to differentiate Gotham’s points from Denver’s points, I created separate dataframes for each team’s points.
f, ax=plt.subplots (figsize=(15,8) )
ax.scatter(x=DJPoints["jam_id"], y=DJPoints["points"], label= "Denver", color="blue")
ax.scatter(x=GJPoints["jam_id"], y=GJPoints["points"], label= "Gotham", color="red")
ax.legend(title="Points" )
ax.set_ylabel ("Number of Points")
ax.set_xlabel ("Jam Number")
plt.title('Denver vs. Gotham Points Scored Per Jam')
Figure 7 Points Scored Per Jam Graph Code
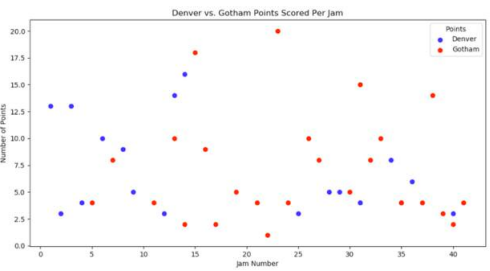
This scatterplot clearly illustrates Denver had several high-scoring jams early in the game, coinciding with Gotham’s high penalty accrual. Denver scored thirteen points in jam one, when Gotham had three penalties, and thirteen points in jam three, when Gotham had another two penalties. Additionally, Denver scored fourteen points in jam thirteen, when Gotham had another three penalties, and Denver had their highest scoring jam of the game in jam fourteen, with sixteen points, where Gotham had another two penalties.
Clearly, accruing penalties negatively impacts a team’s ability to defend against points in individual jams, but how do penalties affect the overall outcome of a game? To find a correlation between game outcome and penalties, I added the cumulative summary of points to the team points dataframes, and created a line graph of the results using matplotlib.
GJPoints["GScore"]=GJPoints.points.cumsum()Figure 9 Amended Points Scored by Gotham Per Jam Code
DJPoints["DScore"]=DJPoints.points.cumsum()
Figure 10 Amended Points Scored by Gotham Per Jam Code
It is immediately evident from the line graph that something changed in jam fourteen. While Gotham’s score steadily creeps higher and higher, Denver’s comes to an abrupt halt in jam fourteen. It takes Denver another eleven jams to get additional points on the board – after jam fourteen, Denver does not score again until jam twenty-five. Looking back at the penalties bar chart, one will note that Gotham gets themselves out of penalty trouble at jam fourteen, accruing only two penalties between jams fourteen and twenty-seven – one of them in jam twenty-five, when Denver gets themselves back onto the scoreboard.
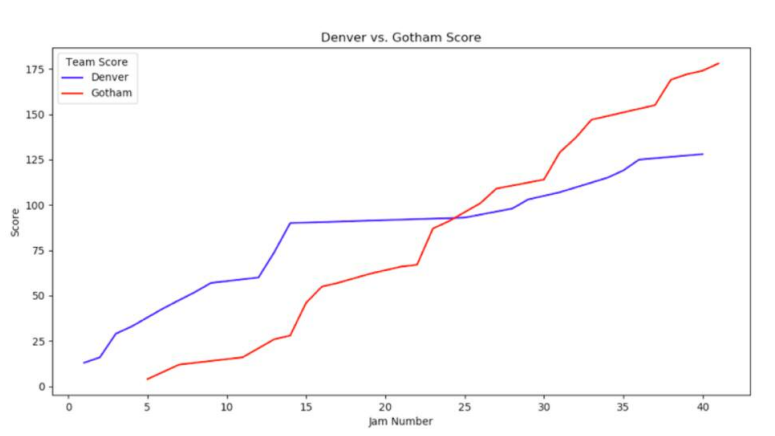
Denver took advantage of Gotham’s early penalties in their matchup during the 2017 International WFTDA Championships Tournament. Denver scored twenty-six points in jams one and three, when Gotham accrued five of their total penalties, and another thirty points in jams thirteen and fourteen when Gotham accrued another five penalties. The games tenor shifted after jam fourteen when Gotham stopped heading to the penalty box, and Denver stopped scoring. In this game, a clear correlation between point differential and penalties accrued (or skaters on the track) exists.
The statistical game data provided online by WFTDA provides insight into team’s strengths and weaknesses, but there is so much more interesting analysis that can be completed. Hopefully the future holds an avenue where anyone can ask a complex data analysis question about a roller derby game, and find the tools to visualize the answer. What questions will you ask about game data?
Check out my code on GitHub: github.com/lagypin/WFTDA_Analysis
References
- (2018, April 15). Retrieved from stats-repo.wftda.com/bout.jsp?boutId=1455| Appendix A | Online Supplemental Material
- Github Repository github.com/lagypin/WFTDA_Analysis
- Stack Overflow Graphing Question stackoverflow.com/questions/50659030/matplotlib-graph-alignment
Like what we do? Consider chipping in a few bucks.